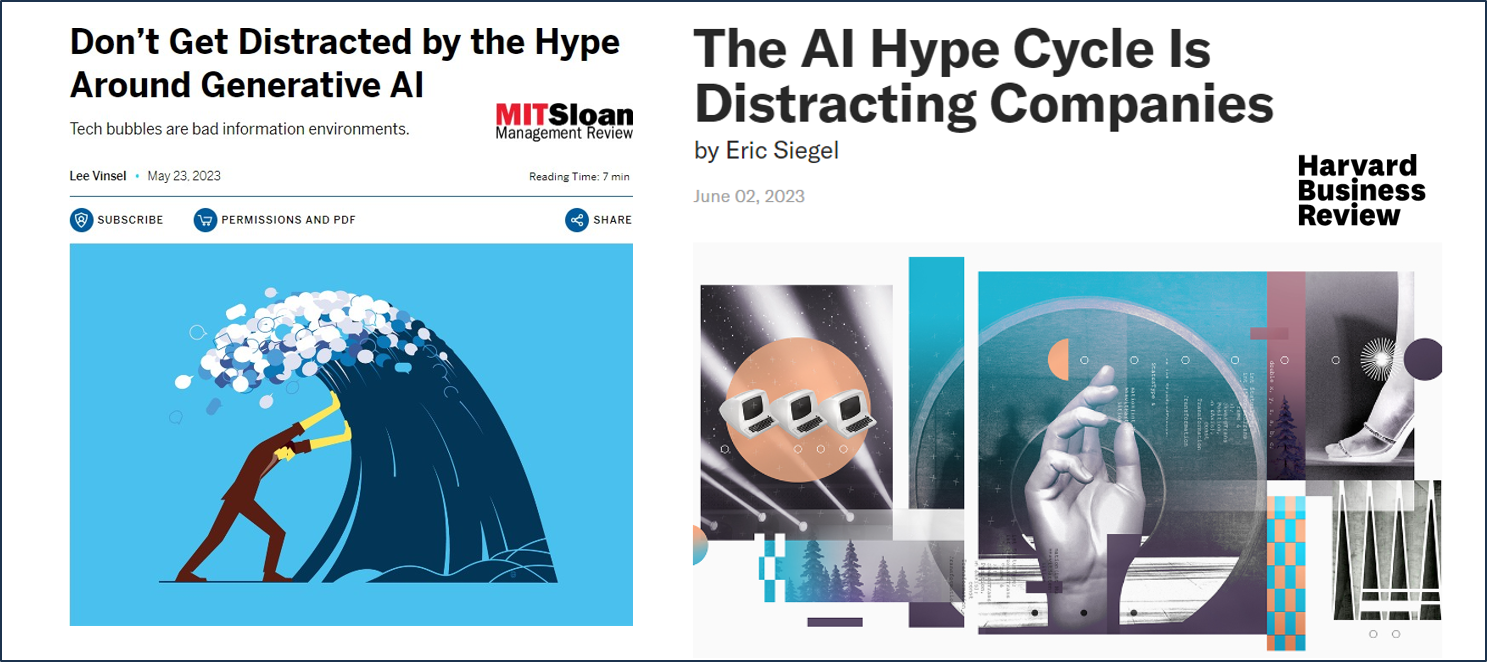
It's been just over a year since GPT4.0 launched, propelling Generative AI into the mainstream. Many organisations are still figuring out whether Generative AI and other AI technologies represent an opportunity, a threat, or both.
Has your organisation figured out the answers to those questions, or does it at least have a framework to do so? If not, then read on as I outline a basic four-step iterative approach to get you started.
While you can use this approach for an initial assessment or exploratory workshop, it can also feed into more detailed strategy, design, and architecture tools and frameworks you may use in your organisation today.
Step 1: Identify which AI technologies may be relevant to your organisation.
When you need a quick introduction to a new class of technologies, Gartner's Hype Cycle is a good starting point. Although it has faced some criticisms*, which you should make yourself aware of, it contains four elements which I find helpful in their own right, described in Points A to D below:
A: List of Technologies.
The Hype Cycle provides a well-researched list of all currently recognised types of technologies within a given technology class, which Gartner updates annually. This list can save you much time when figuring out the scope of a new technology class and identifying which specific technologies within it may be relevant to your organisation.
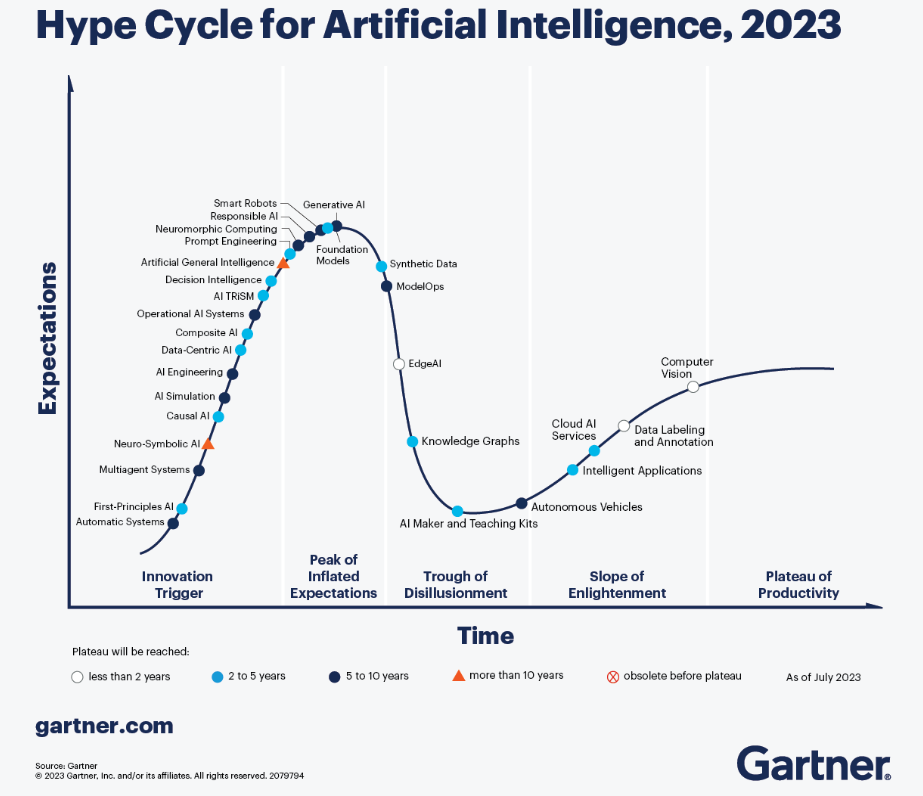
For example, the 2023 AI hype cycle lists twenty-nine types of AI, which is an excellent starting point for shortlisting which ones to explore in more detail.
The basic hype cycle diagram is accessible on Gartner's public website, with more detailed research behind their paywall.**
B: Technology adoption timeframes and time-related issues.
The Hype Cycle predicts when the market expectations for each technology will reach a steady level — the Plateau of Productivity — once it is better understood, which has an implied correlation with the technology's adoption rate over time (See Point D below).
Predictions are divided into four timeframe windows (see the graph timeline key). One additional label is assigned to any technology that has become obsolete since the last report was published. The timeframes can help you prioritise what order to do your research if you have more than a few technologies to consider.
While these predictions are useful, be aware that they don't always have a good track record for being accurate*. To be fair to Gartner, how could they be? This is new technology. I've seen hype cycles revise their forecasts for the plateau by more than ten years over a decade of forecasting as a given technology class did not mature as quickly as expected.***
While some technologies develop more slowly than initially anticipated, Generative AI has experienced several significant breakthroughs in the last decade, surprising even some of the leading experts in this field. Therefore, I recommend treating these timeframes as more guesstimates than estimates, particularly earlier in the hype cycle, and tracking those you are concerned with over time (see Step 3 below).
Another time-related issue is that the horizontal time axis has no scale, which is easy to overlook. If you want to see the actual timing of each stage for each technology, you will need to plot those yourself unless you have a Gartner subscription**.
The final time-related issue is that the hype cycle represents the potential market adoption rate for an overall new technology class. For it to be useful, you need to turn that into a forecast for your industry and organisation since different markets and industries will adopt new technologies at different rates (See Point D below).
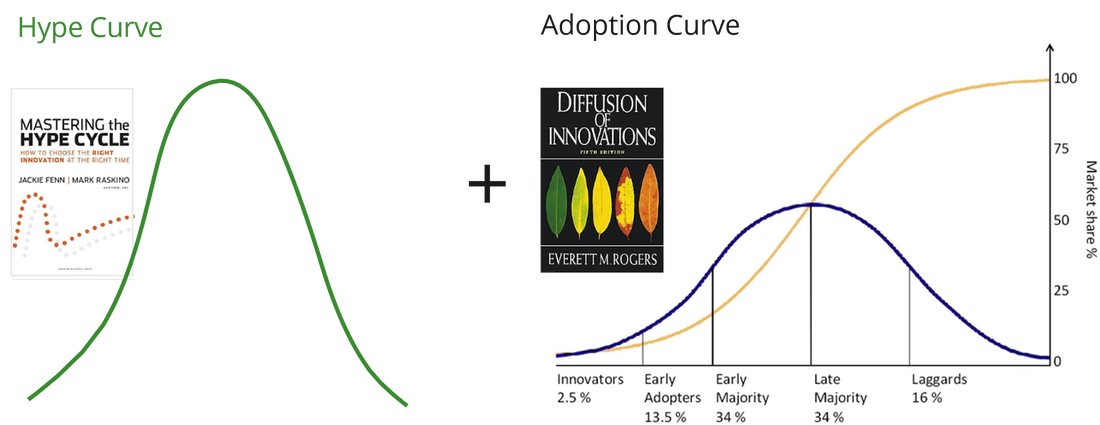
Hype Cycle = Hype Curve + Adoption Curve
For the final two points, It's helpful first to note that The Hype Cycle was initially created by combining two concepts: the Hype Curve, which highlights the general pattern of human behaviour in responding to the emergence of new technology, and the Adoption Curve from the Diffusion of Innovation Theory first published in 1962.
C: The Hype Curve component.
The Hype Curve, or initial wave element, spans the cycle's first three stages: The Innovation Trigger, the Peak of Inflated Expectations, and the Trough of Disillusionment.
- The start of the Hype Curve is helpful because it alerts us to new emerging technologies that we may need to be aware of in the future.
- The peak reminds us to avoid getting caught up in the initial hype accompanying many new technologies after they first emerge.
- The trough reminds us to remain alert as the hype turns sour since this is when innovators and early adopters prove out the technology, one way or another.
The Hype Curve prompts us to consider whether and when our organisation should engage with new technology, but as I will show below, the question is better explored using the Adoption Curve.
D: Adoption Curve component
The Adoption Curve and its theories help us understand each technology's potential market adoption rate over time. The Adoption Curve is more straightforward to combine with other strategy tools and frameworks than the Hype Cycle, making it more useful.
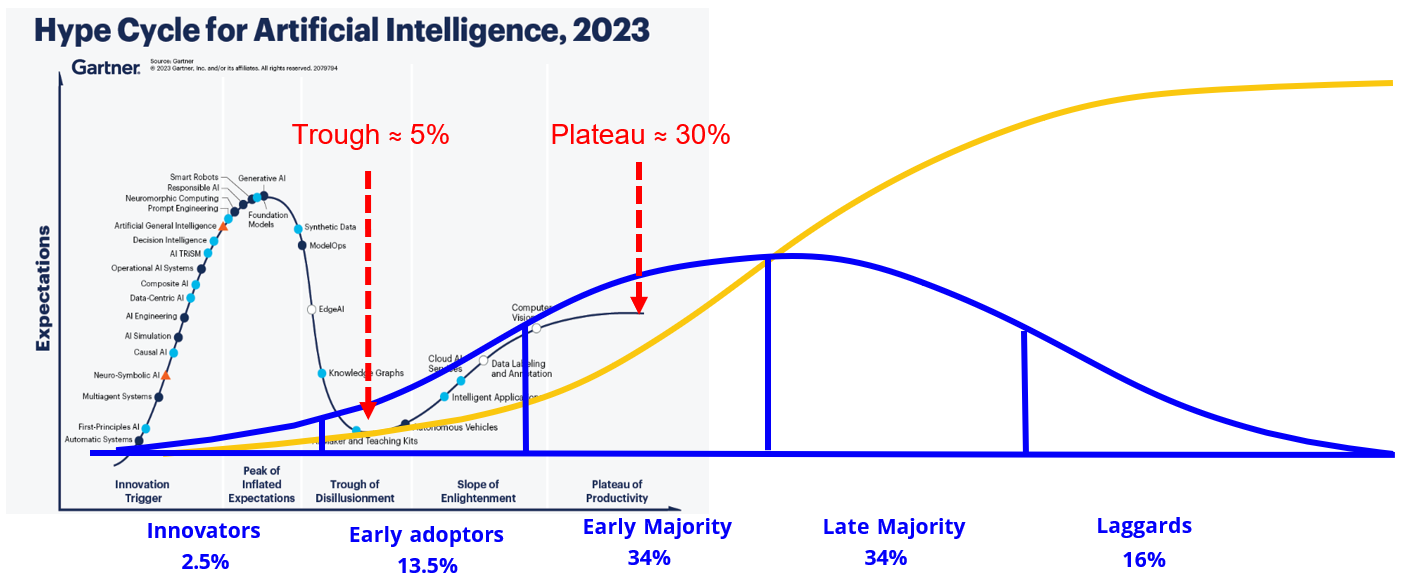
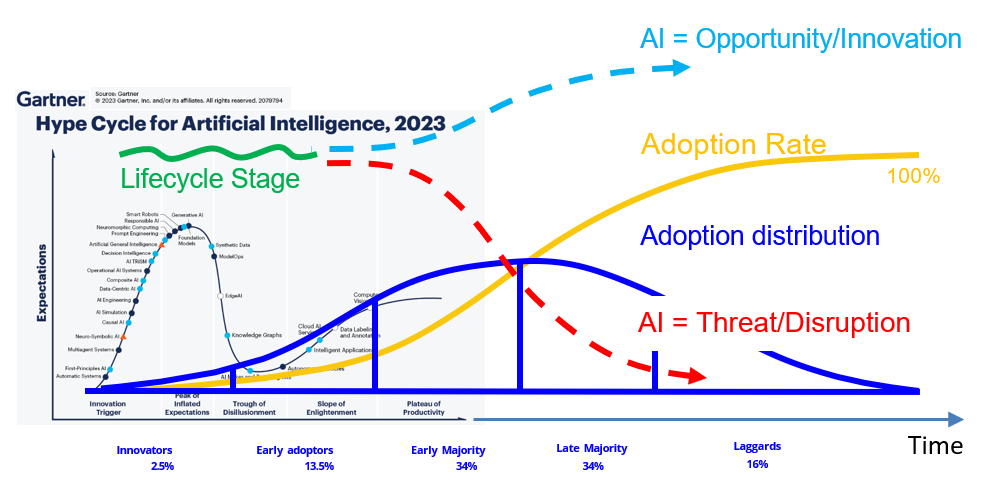
The image below indicates how the Adoption Curve can be aligned with the Hype Cycle curve despite the different axes used on each diagram. The key to aligning these two diagrams comes from several texts describing the Trough of Disillusionment as aligning with a 5% adoption rate and the Plateau of Productivity roughly aligning with a 30% adoption rate.
Step 2: Identify how AI will affect how you create value or impact cost.
The next step is to identify how a new technology might impact your organisation and how it creates value by developing a deeper understanding of each technology's fundamental properties and potential capabilities.
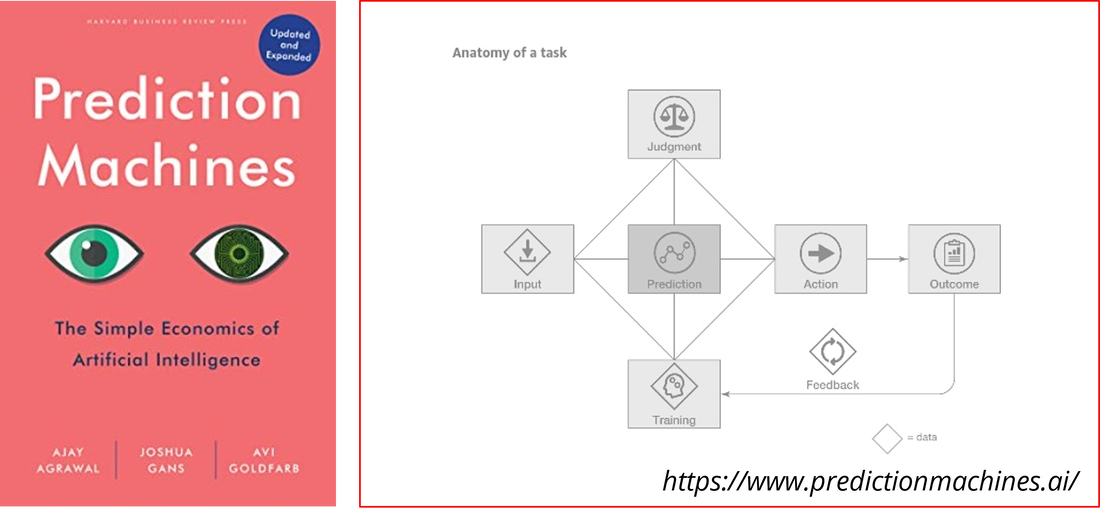
Many resources are available to do this, from online videos, podcasts, and articles to more formalised courses and books. I found two books that provide valuable insights and perspectives: Prediction Machines and Power and Prediction by Ajay Agrawal, Joshua Gans, and Avi Goldfarb.
In Prediction Machines, the authors provide the following diagram, which provides a simple but powerful insight: at a fundamental level, all AI technologies make predictions.
This insight provides a simple but powerful lens to help you identify how different AI technologies might impact various aspects of your organisation and its value proposition.
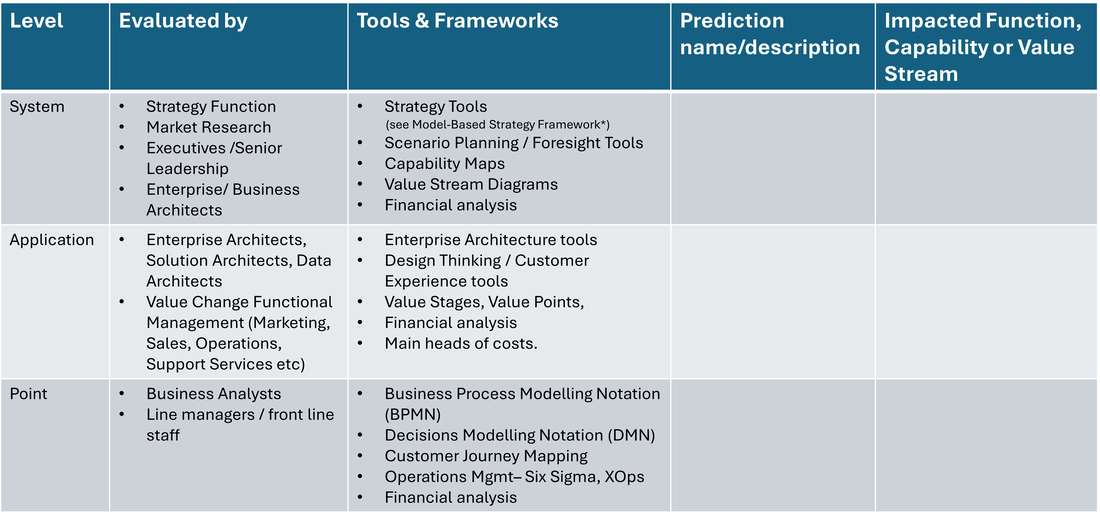
In their follow-up book, Power and Prediction, the authors provide another helpful suggestion: categorising AI's application into three levels: Point Solutions, Application Solutions, or Systems Solutions.
Identifying where predictions are made in your organisation and at what level is a critical first step to help guide and shape further analysis and research.
If you work in design or architecture disciplines, you will recognise that these books provide a simple approach to creating insightful abstractions at different decomposition levels.
This step can also help you identify the impact of AI technologies on your competitors (current, new, substitutes), customers/noncustomers, and suppliers (yours, your competitors).
Below is an example table that outlines who might use the "predictions perspective" for each level in your organisation and how you might map those insights onto other more detailed tools and frameworks from the disciplines of strategy, design, and architecture used in your organisation.
Step 3: Generate forecasts and track actual adoption rates.
Suppose you need more accurate adoption timeframes for your specific markets or industry so that your organisation can make its own strategic decisions. In that case, the next step is to generate predictions by closely monitoring your markets, sectors, or industries for intelligence on actual adoption rates.
In Point D, I recommended tracking adoption rates on the Adoption Curve rather than the Hype Cycle since the Adoption Curve represents the actions of individuals rather than their opinions, which may be easier to identify and track. The Adoption Curve uses a calibrated time axis, and it is easier to overlay other strategy tools, which I will outline in Step 4 below.
So, how do you track the rate of adoption? It comes down to a combination of market and industry research - listening closely to your customers and supply chains while monitoring your competitors - to gauge how successfully these technologies work in practice.
Step 4: Turn your Strategic Intelligence into Action:
What will each AI do to your top-line sales, customer numbers, and retention rates? Are competitors using AI to cut costs, putting downward pressure on prices and margins? Will AI lead to substitute products that will make your value propositions obsolete?
These scenarios can all be represented by lines overlaid on the adoption curve to create what I describe as a Key Factors Graph, which I have mentioned in previous posts.
For example, on the diagram below, I have overlaid lines which represent the possible trajectory of your organisation's life cycle (green line) depending on whether AI adoption represents an opportunity (light blue) or threat (red)
The Adoption Curve can also be overlaid with concepts from other useful strategy tools to provide further insights, such as:
- Geoffery E Moore's Crossing the Chasm, Inside the Tornado, and Zone
- Clayton Christensen's Leaders/Fast Followers and Disruption Playbook
- Rita McGrath — tools from her book Seeing Around Corners
- Growth-Share Index & Experience Curve (BCG/Bruce Henderson)
- Knowledge Funnel (Roger Martin)
- Lean Startup Concepts /MVP (Eric Ries)
The purpose of this research and analysis is not just to provide you with intelligence but also to help you make decisions and take appropriate action. I've written about my approach to strategy and execution in previous articles, such as this one on my StrateStrategy & Execution Playbookgy Execution Playbook.
Let me know if you want to learn more about developing a more comprehensive strategic intelligence system for disruptive technologies or determining how that may impact your strategy.
Footnotes:
* Hype cycle issues: ref Wikipedia — Criticisms.
** Note: I am not affiliated, associated, authorised, endorsed by, or in any way officially connected with Gartner or any of the Authors mentioned in this article.
*** Autonomous vehicles hype cycles 2013–2023.
* Hype cycle issues: ref Wikipedia — Criticisms.
** Note: I am not affiliated, associated, authorised, endorsed by, or in any way officially connected with Gartner or any of the Authors mentioned in this article.
*** Autonomous vehicles hype cycles 2013–2023.

